Investment and Service State Forecast Report
Objective: Gain an understanding of the Investment and Service State Forecast report
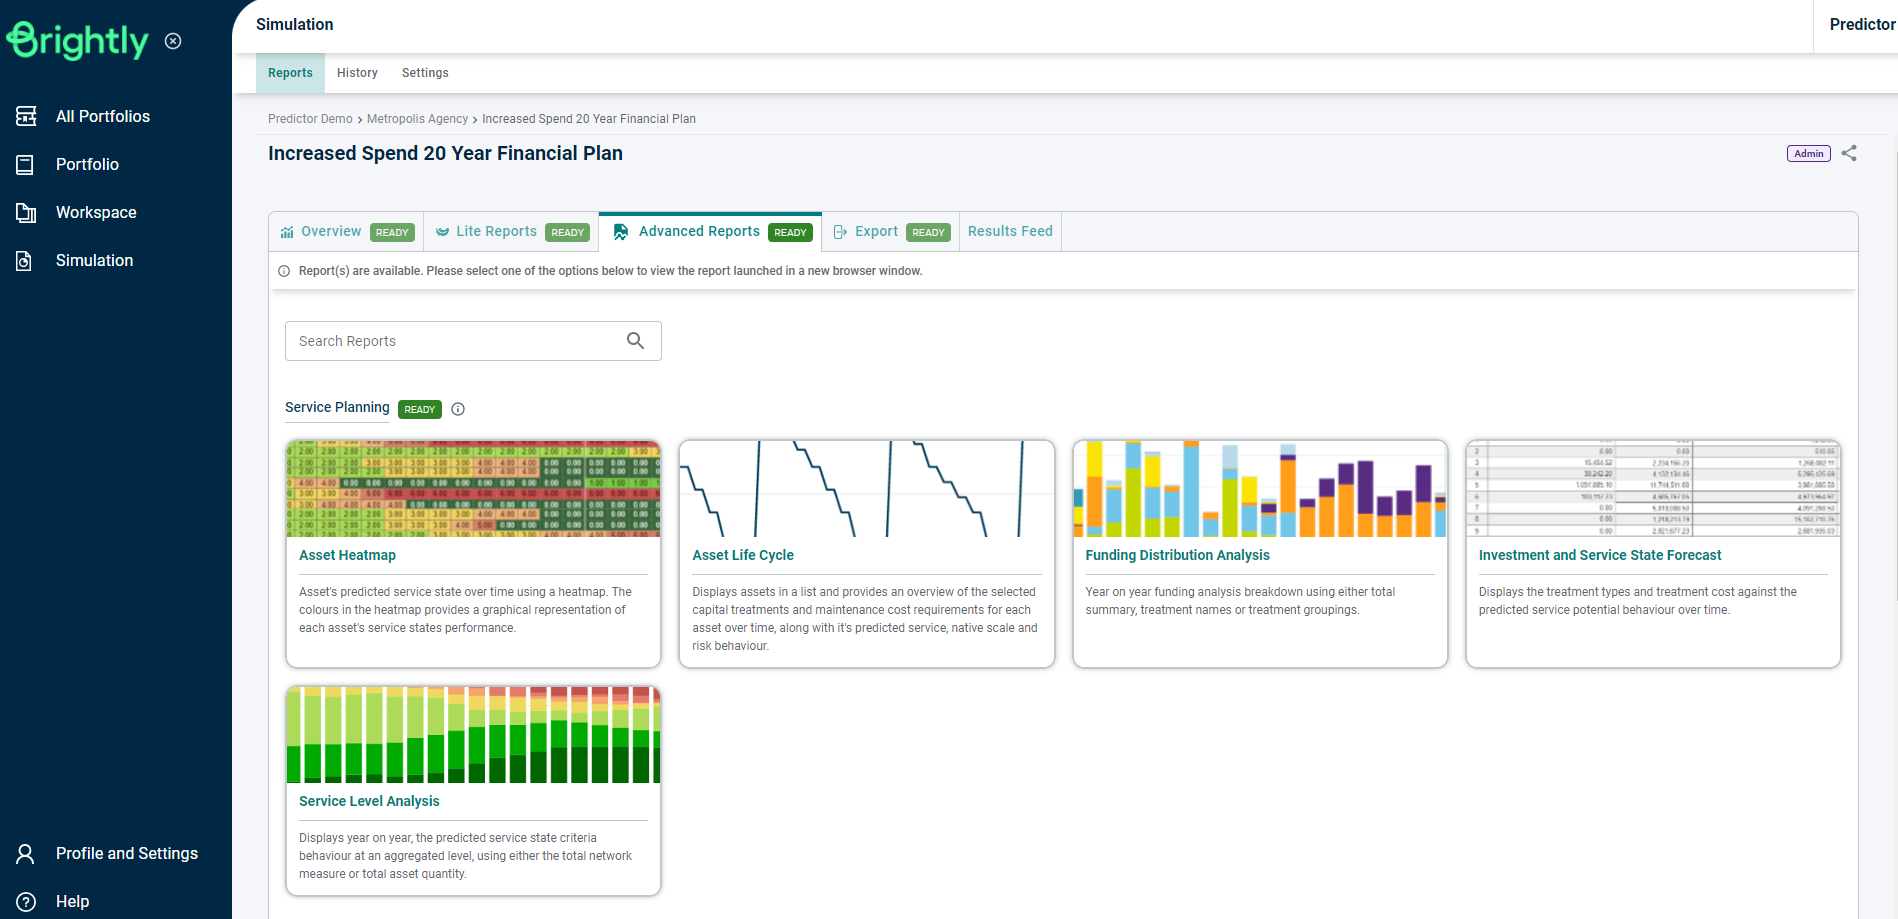
The Investment and Service State Forecast report displays the treatment types and treatment cost against the predicted service potential behaviour, over the duration of a published simulation.
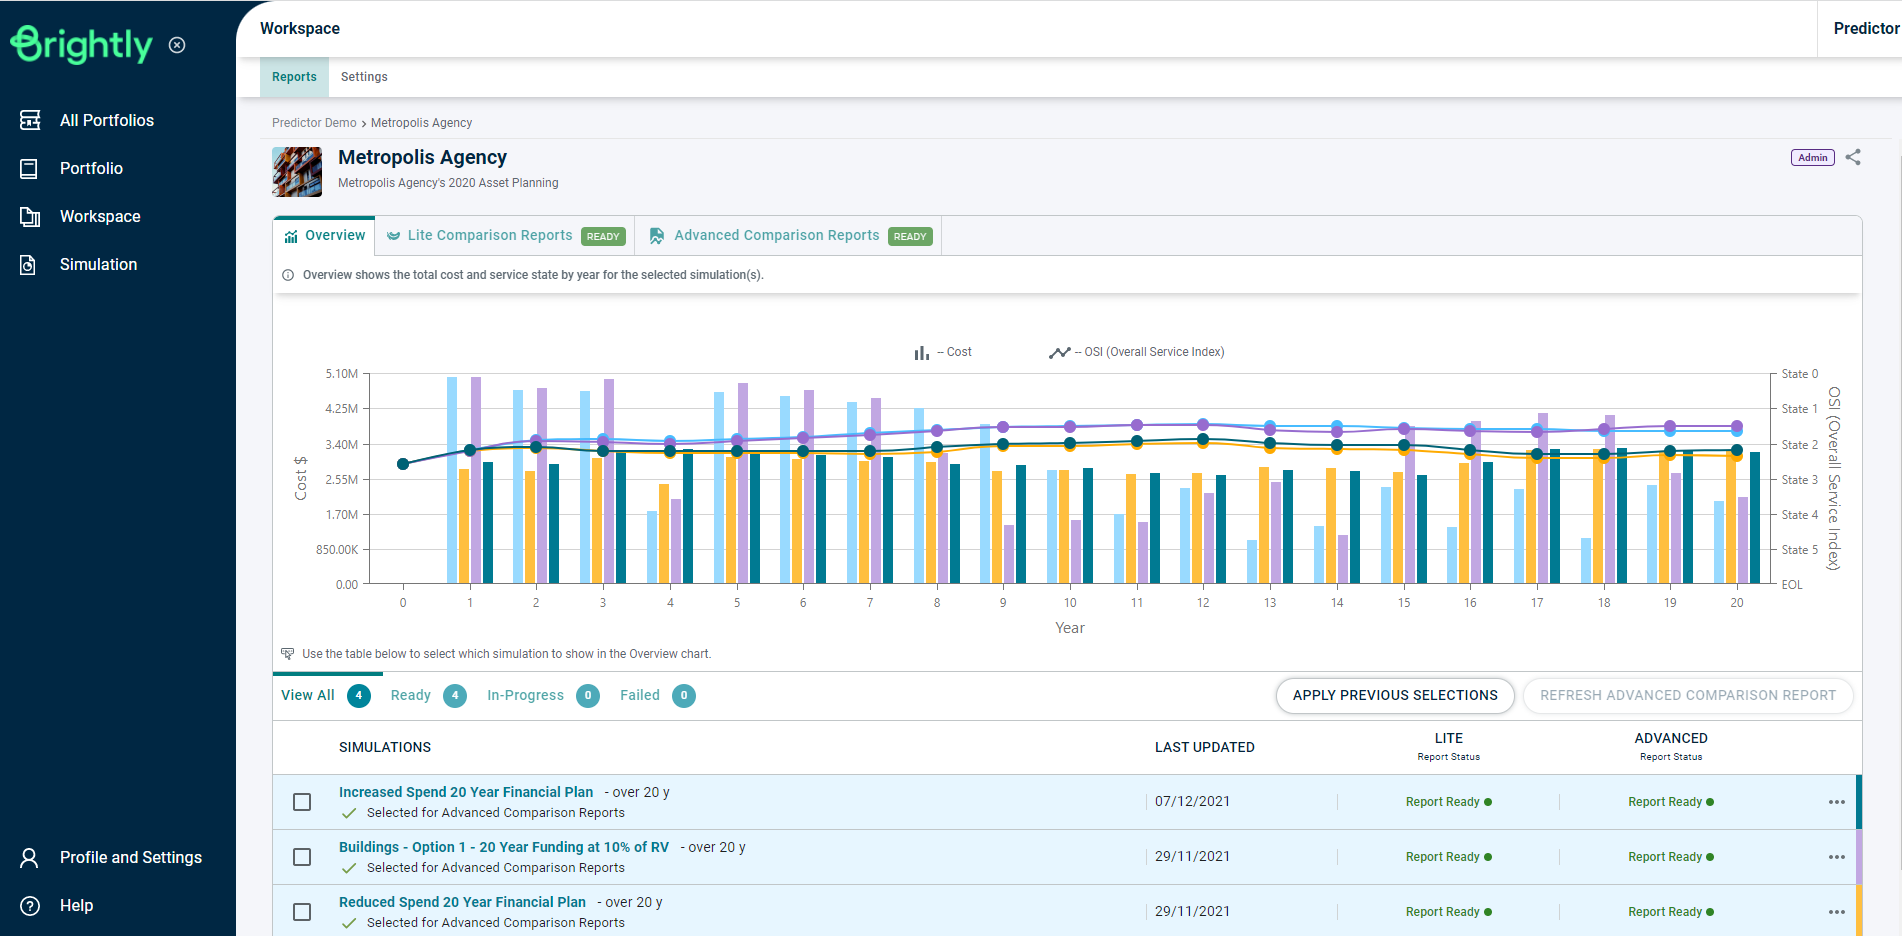
Once the Simulation is loaded, users can click on the 'Investment and Service State Forecast' report in the Advanced Reports tab, under the Service Planning section, or use the Search Reports box to locate the correct report.
This will load the Investment and Service State Forecast report in a new tab within your browser.
The Investment and Service State Forecast report provides the Total Cost by Year divided into columns for each Treatment Type, as well as the Service Criteria Value by Year, for each year of the simulation.
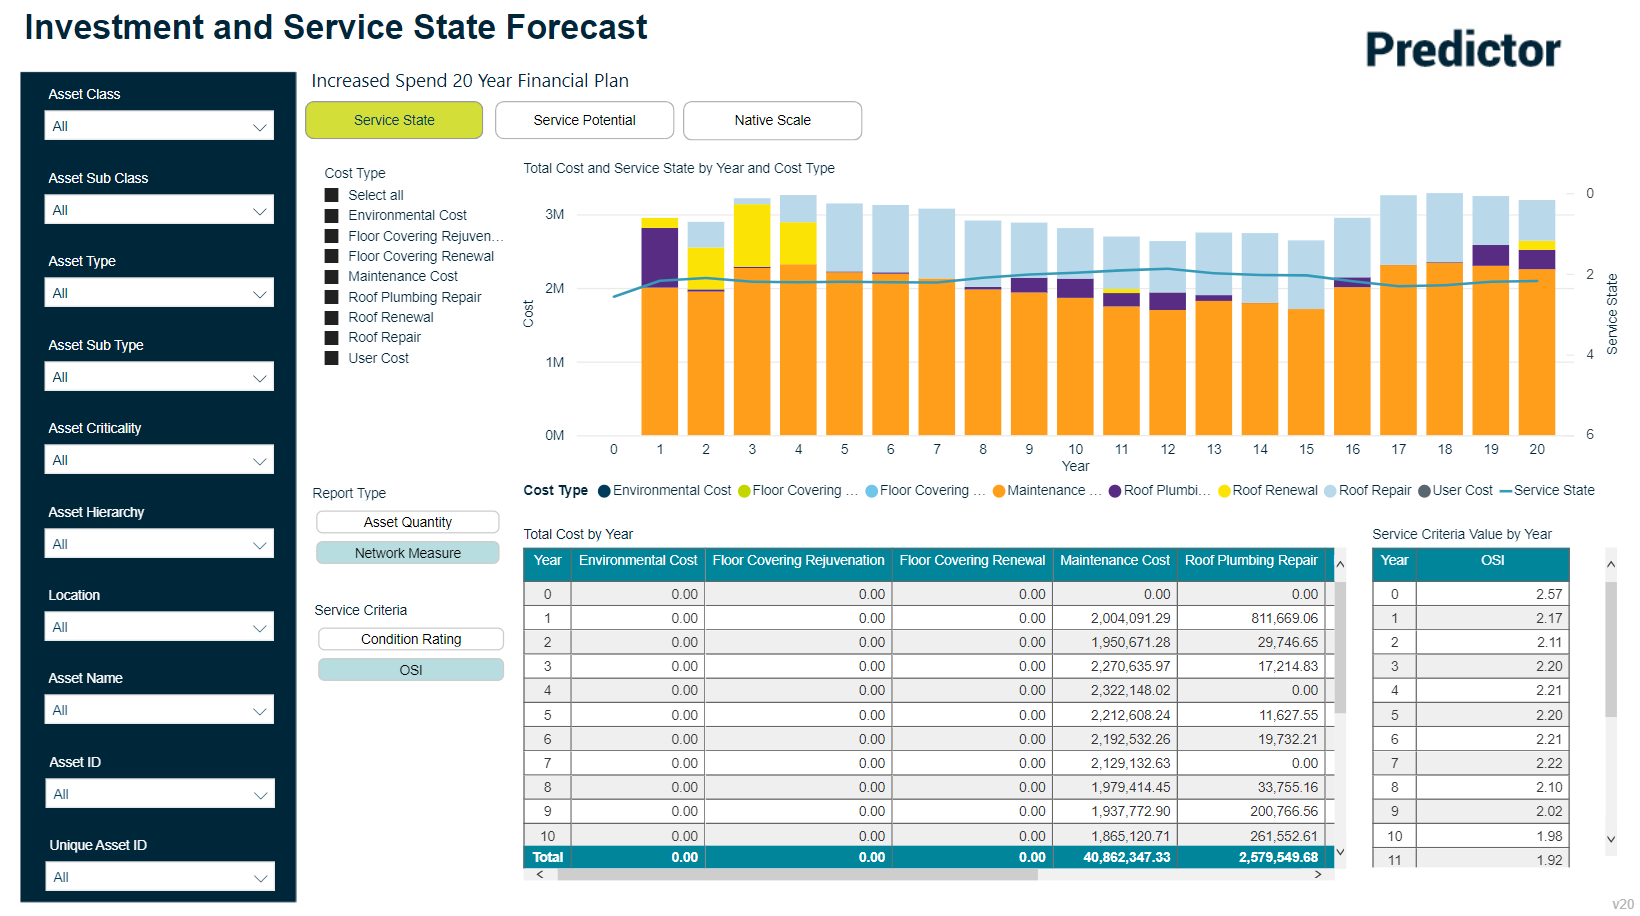
Users can choose to view the Total Cost and Cost Type per year against either the Service State, Service Potential or Native Scale values using the available buttons to switch the reporting graph between these views.
The Report Type can be changed to use either Asset Quantity or Network Measure, and the values displayed in the report can be changed to view the report with a specific Service Criteria.
